Repeat Purchase Rate: The Complete Guide for 2026
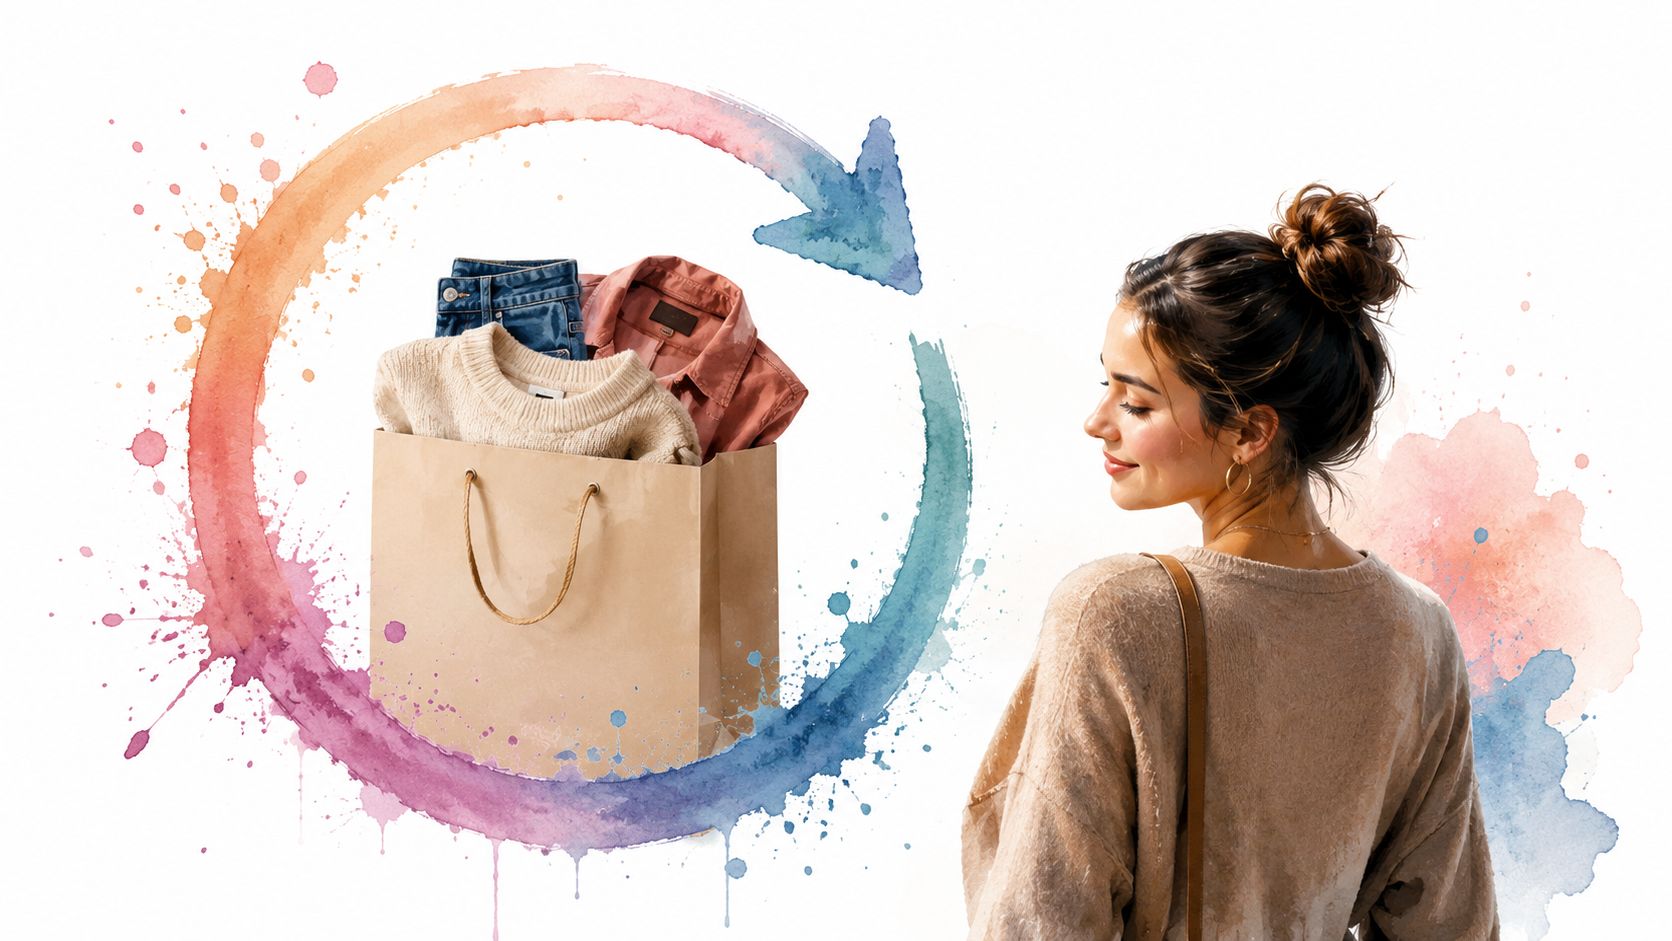
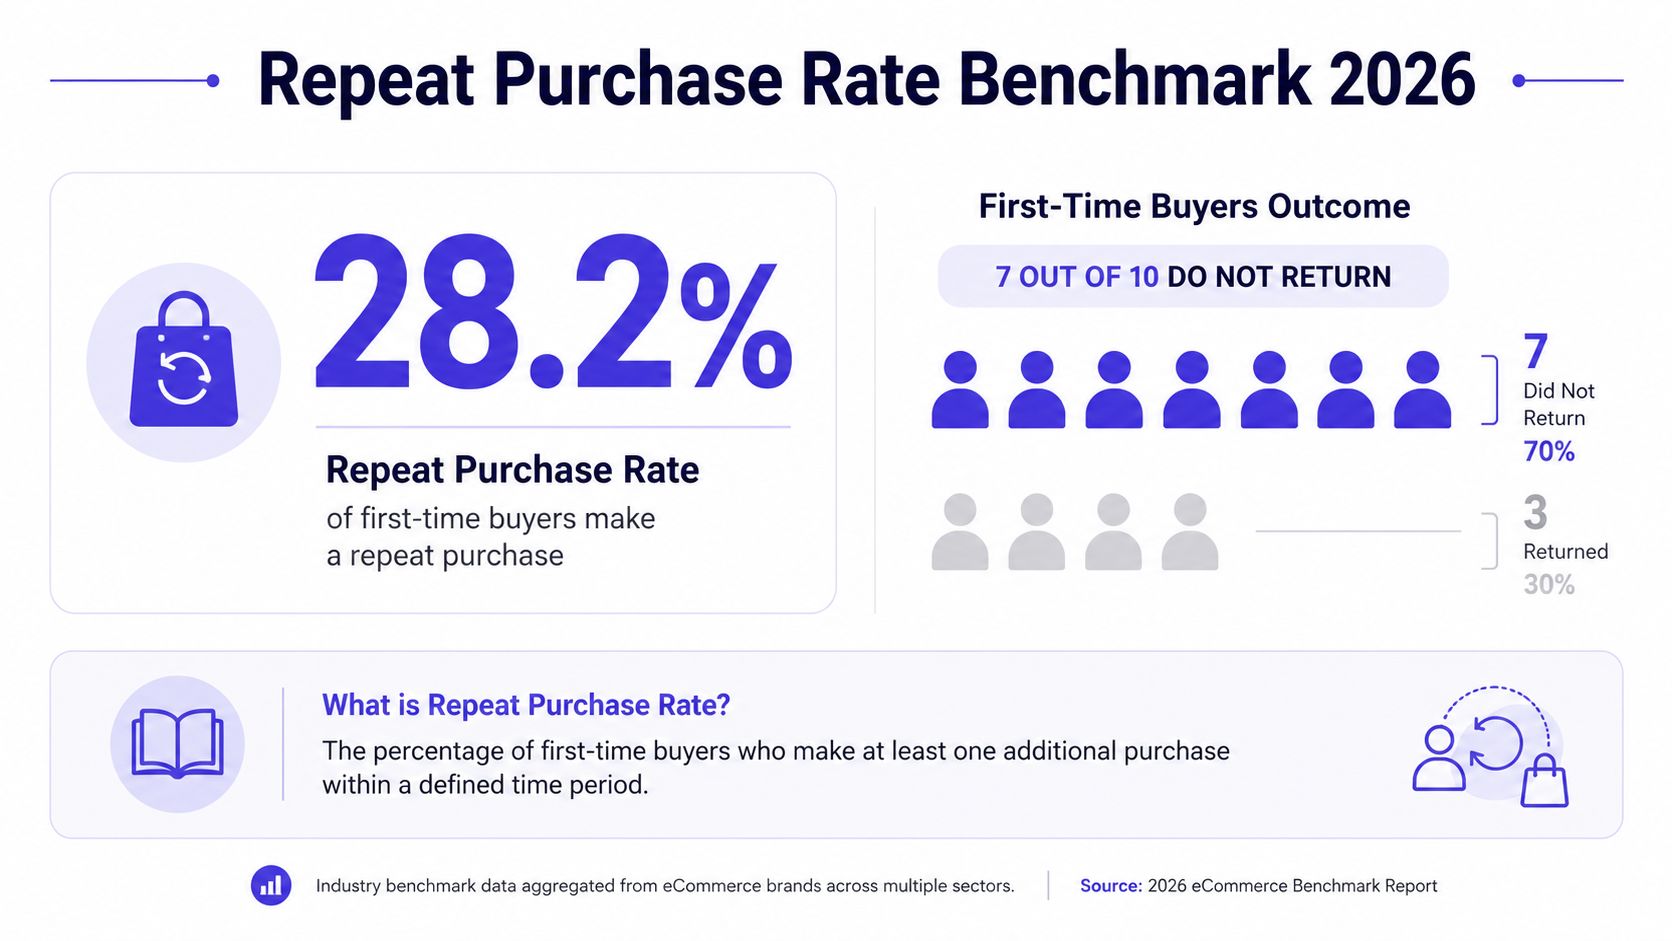
The average ecommerce repeat purchase rate sits at 28.2%, which means roughly 7 in 10 first-time buyers do not come back. That single number is useful because it reminds you that retention is usually the exception, not the default, and that a store's second order is earned, not assumed. According to the same benchmark, 25% to 30% is a typical healthy band, while stores above 40% are top performers, so the important question isn't whether repeat buying matters, it's whether your category, window, and measurement method make your number meaningful (2025–2026 ecommerce benchmark).
What Repeat Purchase Rate Really Means in 2026
Repeat purchase rate is the share of customers who buy more than once inside a chosen time window. In plain English, it answers a simple question, how many first-time buyers came back and placed another order.
That sounds straightforward until you look at the math. A store measured over 30 days will look very different from the same store measured over 365 days, because the window changes who counts as “repeat” and who hasn't had enough time to return yet (definition and formula framing, time-bound cohort guidance).
The benchmark that matters most for context is the 28.2% cross-vertical average, with the healthier range sitting around 25% to 30% and top-performing stores above 40% (benchmark summary). But another large DTC dataset reports an 18.8% aggregate rate across 156,000 customers, which is a good reminder that the number shifts with category mix and measurement design (156K-customer benchmark).
Practical rule: if your dashboard shows only one repeat purchase rate number, it's hiding more than it's revealing. You need the window, the category split, and the time to second purchase before you can judge whether retention is healthy.
The reason ecommerce teams care so much is economic, not academic. Repeat buying is the difference between a one-and-done acquisition machine and a business that can spread customer acquisition over multiple orders, which is central to lifetime value math (operational interpretation).
The Repeat Purchase Rate Formula and a Worked Example
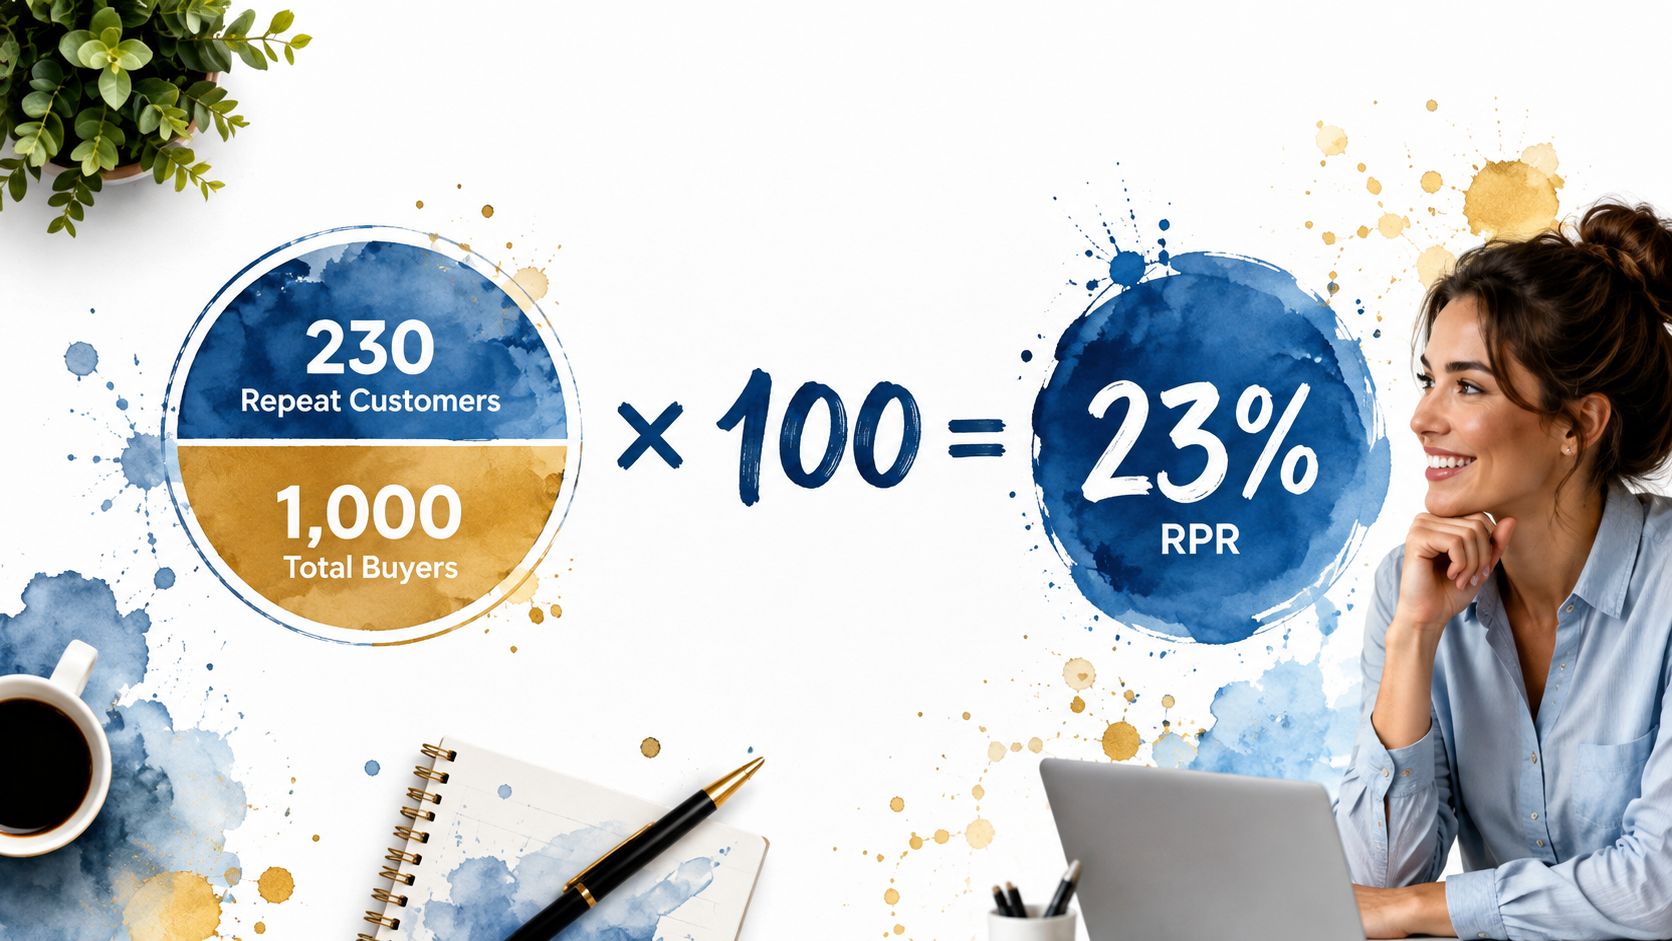
The standard formula is simple enough to write on a whiteboard. Repeat purchase rate = customers with 2 or more orders divided by all unique customers, multiplied by 100 (formula reference, time-bound version).
Suppose an apparel store had 1,000 unique buyers in the last 12 months and 230 of them placed a second order. The repeat purchase rate is 23%, because 230 divided by 1,000 equals 0.23, then multiplied by 100 gives 23. That's the cleanest way to read the metric, and it's why the denominator matters as much as the numerator.
Window choice changes the story
A 365-day window captures slower repeat cycles, while 30-day or 60-day windows focus on near-term retention and post-purchase momentum (window sensitivity, cohort approach). If you measure a replenishment brand over 30 days, you may understate the business. If you measure a fashion store over 365 days, you may still miss the timing problem that matters most.
A fixed time window is better than a lifetime view, because unbounded counts quietly drift upward over time and make old cohorts look healthier than they are.
Two implementation choices come up constantly. Customer-level measurement tracks unique shoppers by identity, while household-level measurement makes more sense in CPG-style panel data where the primary question is whether the household returned at least once (household framing). Refunds, exchanges, and B2B accounts should be handled consistently inside the same rule set, otherwise the metric starts describing accounting behavior instead of buying behavior.
The best practical habit is to write the window into the metric name, such as 12-month repeat purchase rate, so nobody mistakes a short-cycle number for a year-long one. That small labeling choice prevents a lot of bad comparisons later.
Realistic Benchmarks by Category and What They Actually Mean
The biggest mistake people make is treating repeat purchase rate like one universal score. A fashion brand and a consumables brand are not playing the same game, because purchase frequency, replenishment logic, and product cycle all shape the number (category context).
Here's the practical way to read it, category by category.
| Category | Typical 365-Day Range | Common Lookback Window | What Good Looks Like |
|---|---|---|---|
| Fashion | 12% to 17% | 365 days | A lower annual rate can still be normal if buying cycles are long |
| Consumables | 22% to 44% | 365 days, sometimes shorter | A stronger rate usually reflects replenishment and habit |
| Beauty | 30% to 40% | 365 days | Repeats tend to follow routine usage and brand trust |
| Food | 22% to 44% | 365 days | Timely replenishment matters more than broad loyalty language |
| Supplements | 22% to 44% | 365 days | Good performance often comes from returning use patterns |
| Home goods | 7% to 18% | 365 days | A lower number can be expected because the cycle is slower |
Those ranges line up with the broader DTC benchmark that places the all-category average at 18.8% across 156,000 customers, with 12% to 17% for fashion and apparel and 22% to 44% for consumables (benchmark breakdown, average interpretation).
A low annual rate in fashion is not automatically a problem. Shoppers may love the brand, browse again later, or buy only when the occasion changes, which means the metric can be healthy even when it looks modest on paper. In consumables, though, a low rate is harder to excuse because the category itself creates a natural reason to come back.
That's why “good” has to be tied to the product type, not a generic leaderboard. A coffee or supplement brand should worry about weak repeat behavior much faster than a home decor store, because the purchase rhythm is very different.
Setting Up Tracking and Dashboards the Right Way
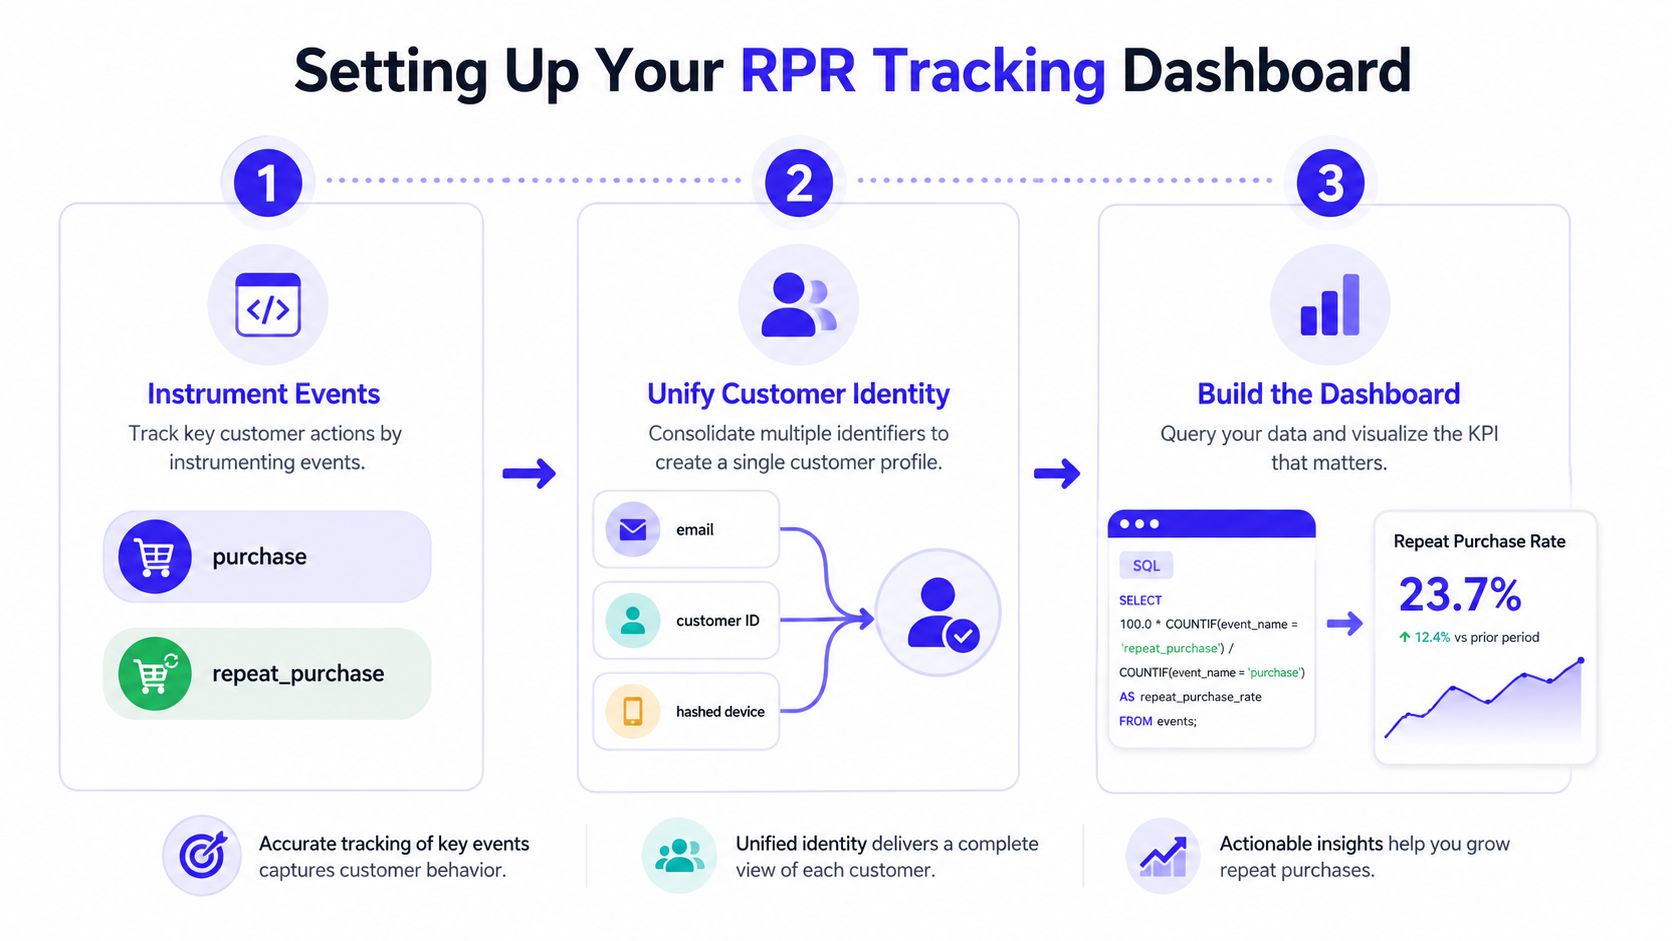
Good measurement starts with clean event design. Track purchase, repeat_purchase, and order_id, then unify identity through email, customer ID, and any stable device or account signal you trust. If those identifiers aren't stitched together, one person can look like three customers, and repeat purchase rate gets distorted fast.
Build the metric so it can't lie
The most reliable setup counts customers with 2+ orders inside a fixed lookback window, then divides that by all customers who placed at least one order in that same window (standard formula, cohort guidance). That keeps the numerator and denominator inside the same time frame, which is what makes the metric operational instead of decorative.
A minimal dashboard should show three things together: the headline repeat purchase rate, time to second purchase, and repurchase cycle days. If the headline percentage moves but the second purchase keeps getting delayed, the store may not be improving at all, it may just be stretching the same repeat behavior over a longer period.
Watch the traps: refunded orders counted as real purchases, guest checkouts counted twice, and lifetime windows that never reset. Each one can make retention look better than it is.
For a practical retention lens, pair the metric with the guide at customer retention in ecommerce. It's easier to spot what changed when the dashboard separates near-term behavior from longer buying cycles.
The cleanest version of the metric is boring on purpose. It uses one window, one customer definition, and one rule for edge cases. That consistency matters more than fancy visualizations.
Why Apparel Stores Struggle and Where Confidence Fits In
Fashion tends to trail the ecommerce average because the category fights friction on multiple fronts at once. Shoppers hesitate before buying, returns are more emotionally expensive than they look on a spreadsheet, and a dress or top often isn't a replenishment item in the first place.
A realistic apparel scenario is easy to recognize. A shopper orders a dress, opens the package, decides the style isn't what they expected, sends it back, and never builds enough confidence to buy again. The product wasn't necessarily bad, but the post-purchase experience didn't create trust, so the second order never happened.
Flat-lay clothing photos work best when the goal is the most accurate style preview. That matters because shoppers don't need a sizing promise from a visual tool, they need to see how it looks, visualize the style, and decide whether the appearance feels right before they buy.
The Chrome extension is the fast path for that. It installs in a couple of seconds, and shoppers can right-click product images on Zara, H&M, Amazon, Shein, Vinted, Depop, and similar sites to preview the look instantly. That means the shopper stays on the page, compares outfits without jumping into new tabs, and gets an instant visual read before the item ever lands in the cart.

That kind of pre-purchase confidence is especially relevant in apparel, where hesitation often comes before the first order, not after it. One practical option is the app at TryThisFit, which lets shoppers upload a photo and preview how clothing looks on them in seconds, with no account needed. The free Chrome extension at trythisfit.com/go/extension/chrome handles the right-click flow on shopping sites, and the preview history lives at /history for saved try-ons.
I like this lens because it changes the retention conversation. Instead of treating repeat purchase rate as a post-hoc loyalty score, it treats style confidence as a lever that can reduce hesitation, shorten the path to a second purchase, and make returning feel easier.
Stop Chasing the Wrong Number and Read These Instead
A higher repeat purchase rate is not automatically a better business. A store can post a strong percentage and still lean on heavy discounts, low-margin repeat orders, or a tiny base of loyalists that isn't broad enough to support durable growth.
That's why the headline rate should sit beside other retention signals. Time to second purchase tells you how fast trust converts into a real second order, median days between orders shows the actual buying rhythm, and repurchase rate by category reveals whether one product line is carrying the whole store. Revenue concentration from repeat buyers matters too, because a healthy percentage can still hide fragile economics if a small group drives most of the follow-on sales.
Better question: are repeat orders coming from more customers, or just from the same loyal buyers recycling through discounts?
The ecommerce conversion lens in this conversion guide becomes more useful once you stop treating retention as a single score. Conversion and repeat purchase rate often move together, but they don't tell the same story, and a store can improve one while hurting the other.
The contrarian point is simple. Don't optimize for a prettier percentage if the underlying behavior is weak. Optimize for earlier second purchases, broader cross-category return, and a retention profile that matches your product type.
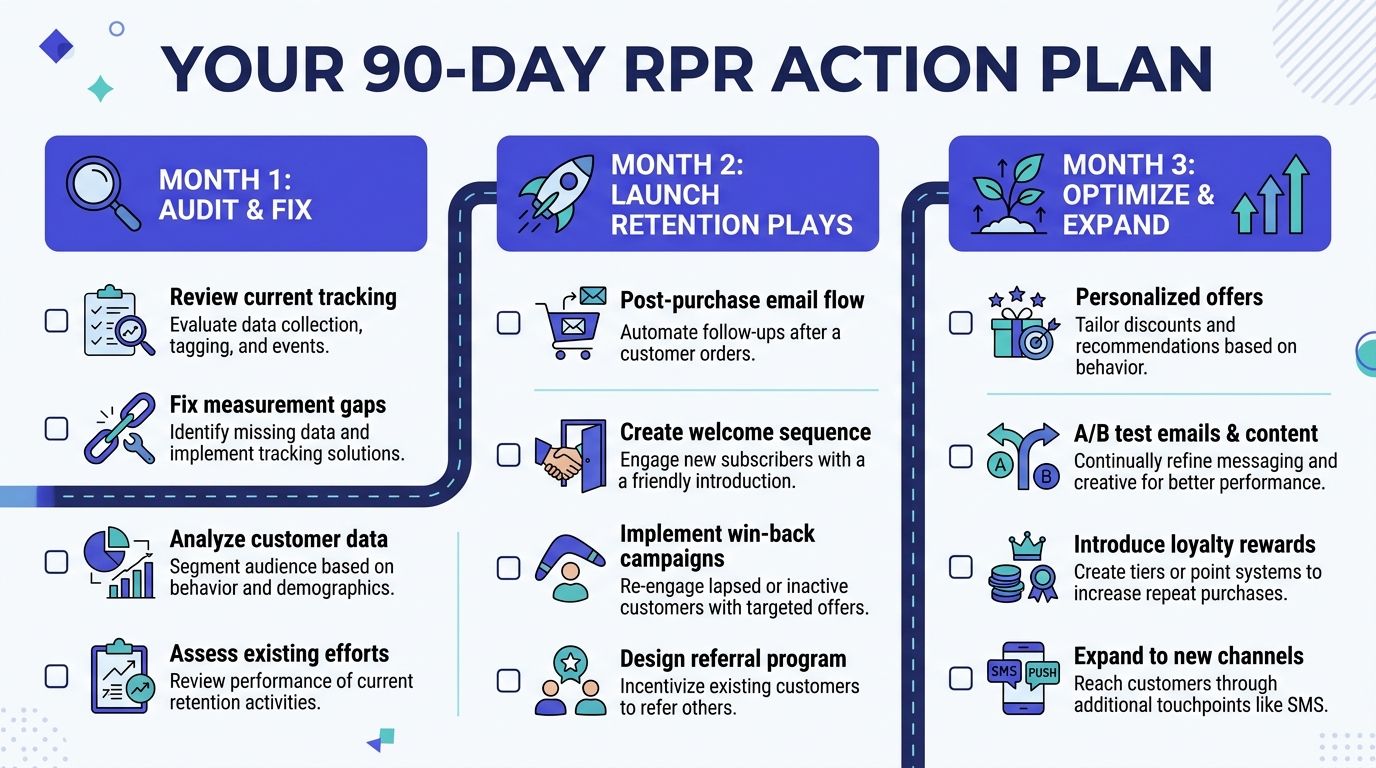
Your 90-Day Repeat Purchase Rate Action Plan
The first 30 days should be about measurement, not messaging. Audit the current dashboard, confirm the customer definition, and check whether refunds, exchanges, guest orders, and duplicate identities are distorting the number. If the metric isn't trustworthy, every retention test after that is guesswork.
The next 30 days should focus on the plays that move repeat behavior fastest. Build a post-purchase flow, add replenishment reminders where they make sense, and segment by category so the message matches the product cycle. A consumable doesn't need the same follow-up logic as a jacket.
Month 1 to Month 3 roadmap
- Month 1, Audit and fix: review current tracking, then close measurement gaps before you launch new flows.
- Month 2, Launch retention plays: use post-purchase email, reminders, and loyalty prompts where the category supports them.
- Month 3, Optimize and expand: test personalized offers, category cross-sells, and pre-purchase confidence tools that reduce hesitation before the first order.
The last 30 days are where pre-purchase confidence tools start to matter. For apparel and visual shopping, TryThisFit gives shoppers an instant way to see how it looks before they buy, and that can complement retention work by making the first purchase feel easier to repeat later. If you want the quickest entry point, install the free Chrome extension, start at TryThisFit, and save your try-ons in /history so you can compare styles without starting over.
For a deeper retention lens, pair this plan with customer experience improvement. The stores that win don't just push the percentage up, they make the second order feel obvious.
TryThisFit helps shoppers preview how clothing looks on them in seconds, with no accounts needed and a free Chrome extension that works across shopping sites. If repeat purchase rate matters to your store, start by making the first choice feel more confident, then visit TryThisFit to try the app and extension for yourself.
Try Virtual Try-On Now
See how clothes look on you before you buy - works with any online store
Get Started Free